Tips & Tricks

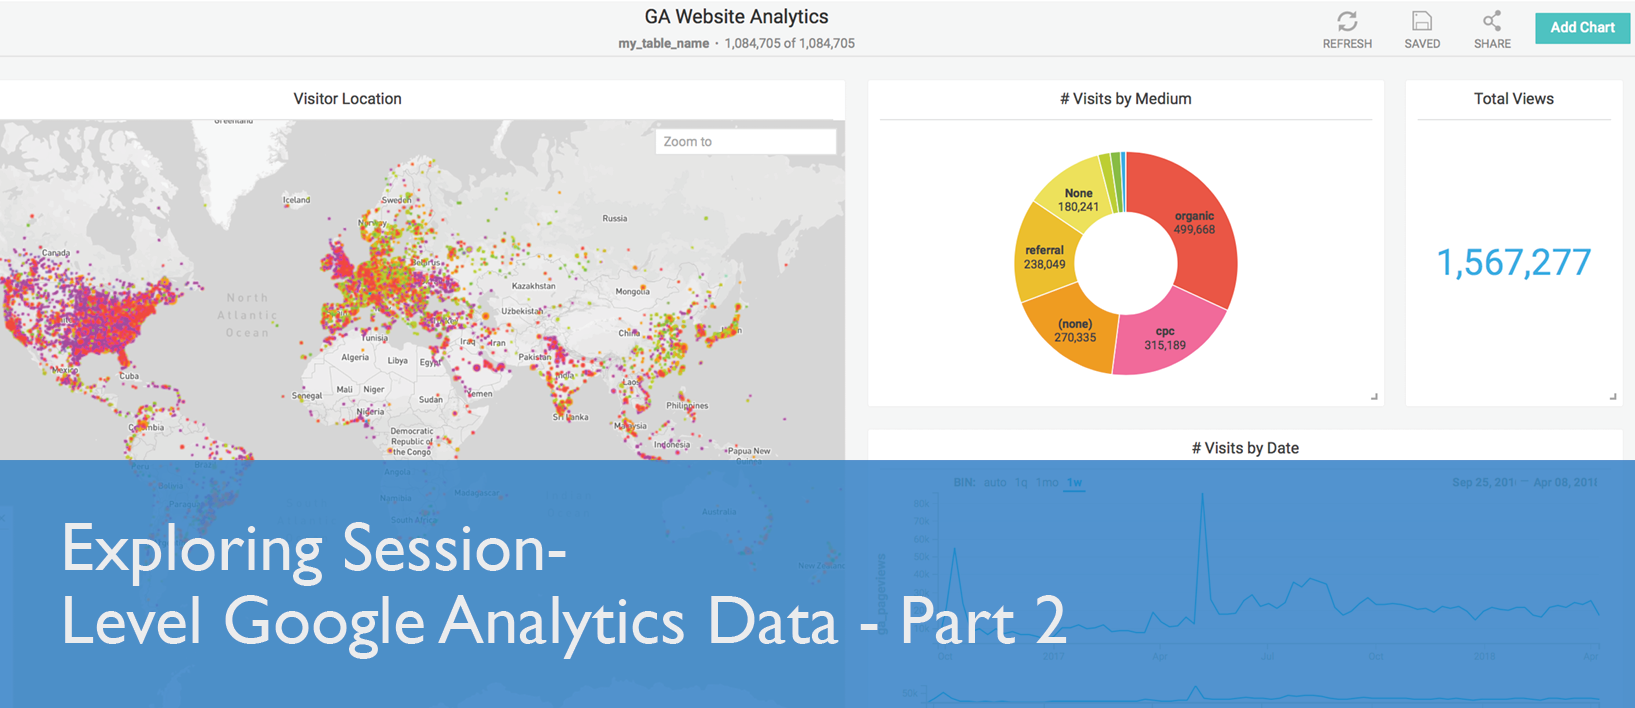
Using MapD Immerse you can visually interact and analyze the Google Analytics session data to determine how people get to your website

A common question faced in the petabyte economy is when, and how, to embrace a distributed, scale out architecture. I will argue here that it makes sense to push for the simplest and cheapest solution that will solve the problem.

Mature enterprises have several tiers of legacy architecture, tied together as new technologies and use-cases arise. When high-performance, interactive analytics needs unfold, OmniSci is the perfect complement.

The formal Big Data Bowl contest ended January 25, but with the Super Bowl coming up this weekend, I wanted to share how I loaded this data into OmniSci Cloud and some simple insights I found while playing with it. Follow along and you too will be exploring the NFL data in no time.

In this blog, we use NASA data to analyze the effects of spaceflight microgravity on mice using MapD Community Edition.

We’ll show how MapD can work with IoT to visualize live data from sensors, which opens the door for endless applications.

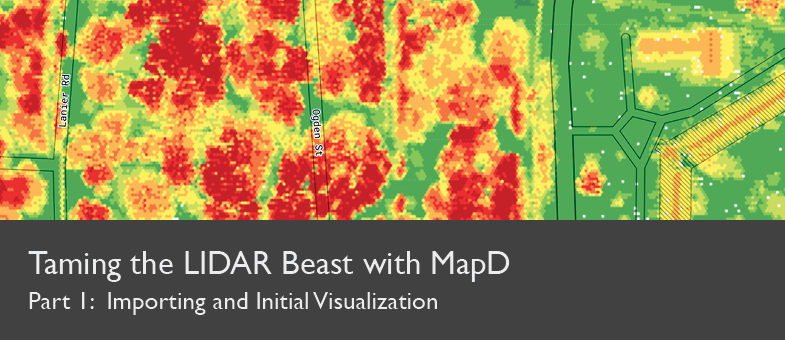
Learn how to transform LIDAR data for use in MapD’s interactive visualization and analysis environments.

OmniSci can be used to navigate and analyze years of fine grain historical traffic data. This post analyzes San Francisco traffic from 2015-2019, showing an increase in congestion in key commuting routes.


