In this article, we'll demonstrate the ease of using Jupyter notebooks with open source Python libraries for visual charts to interact with data in OmniSci Database on a Mac.

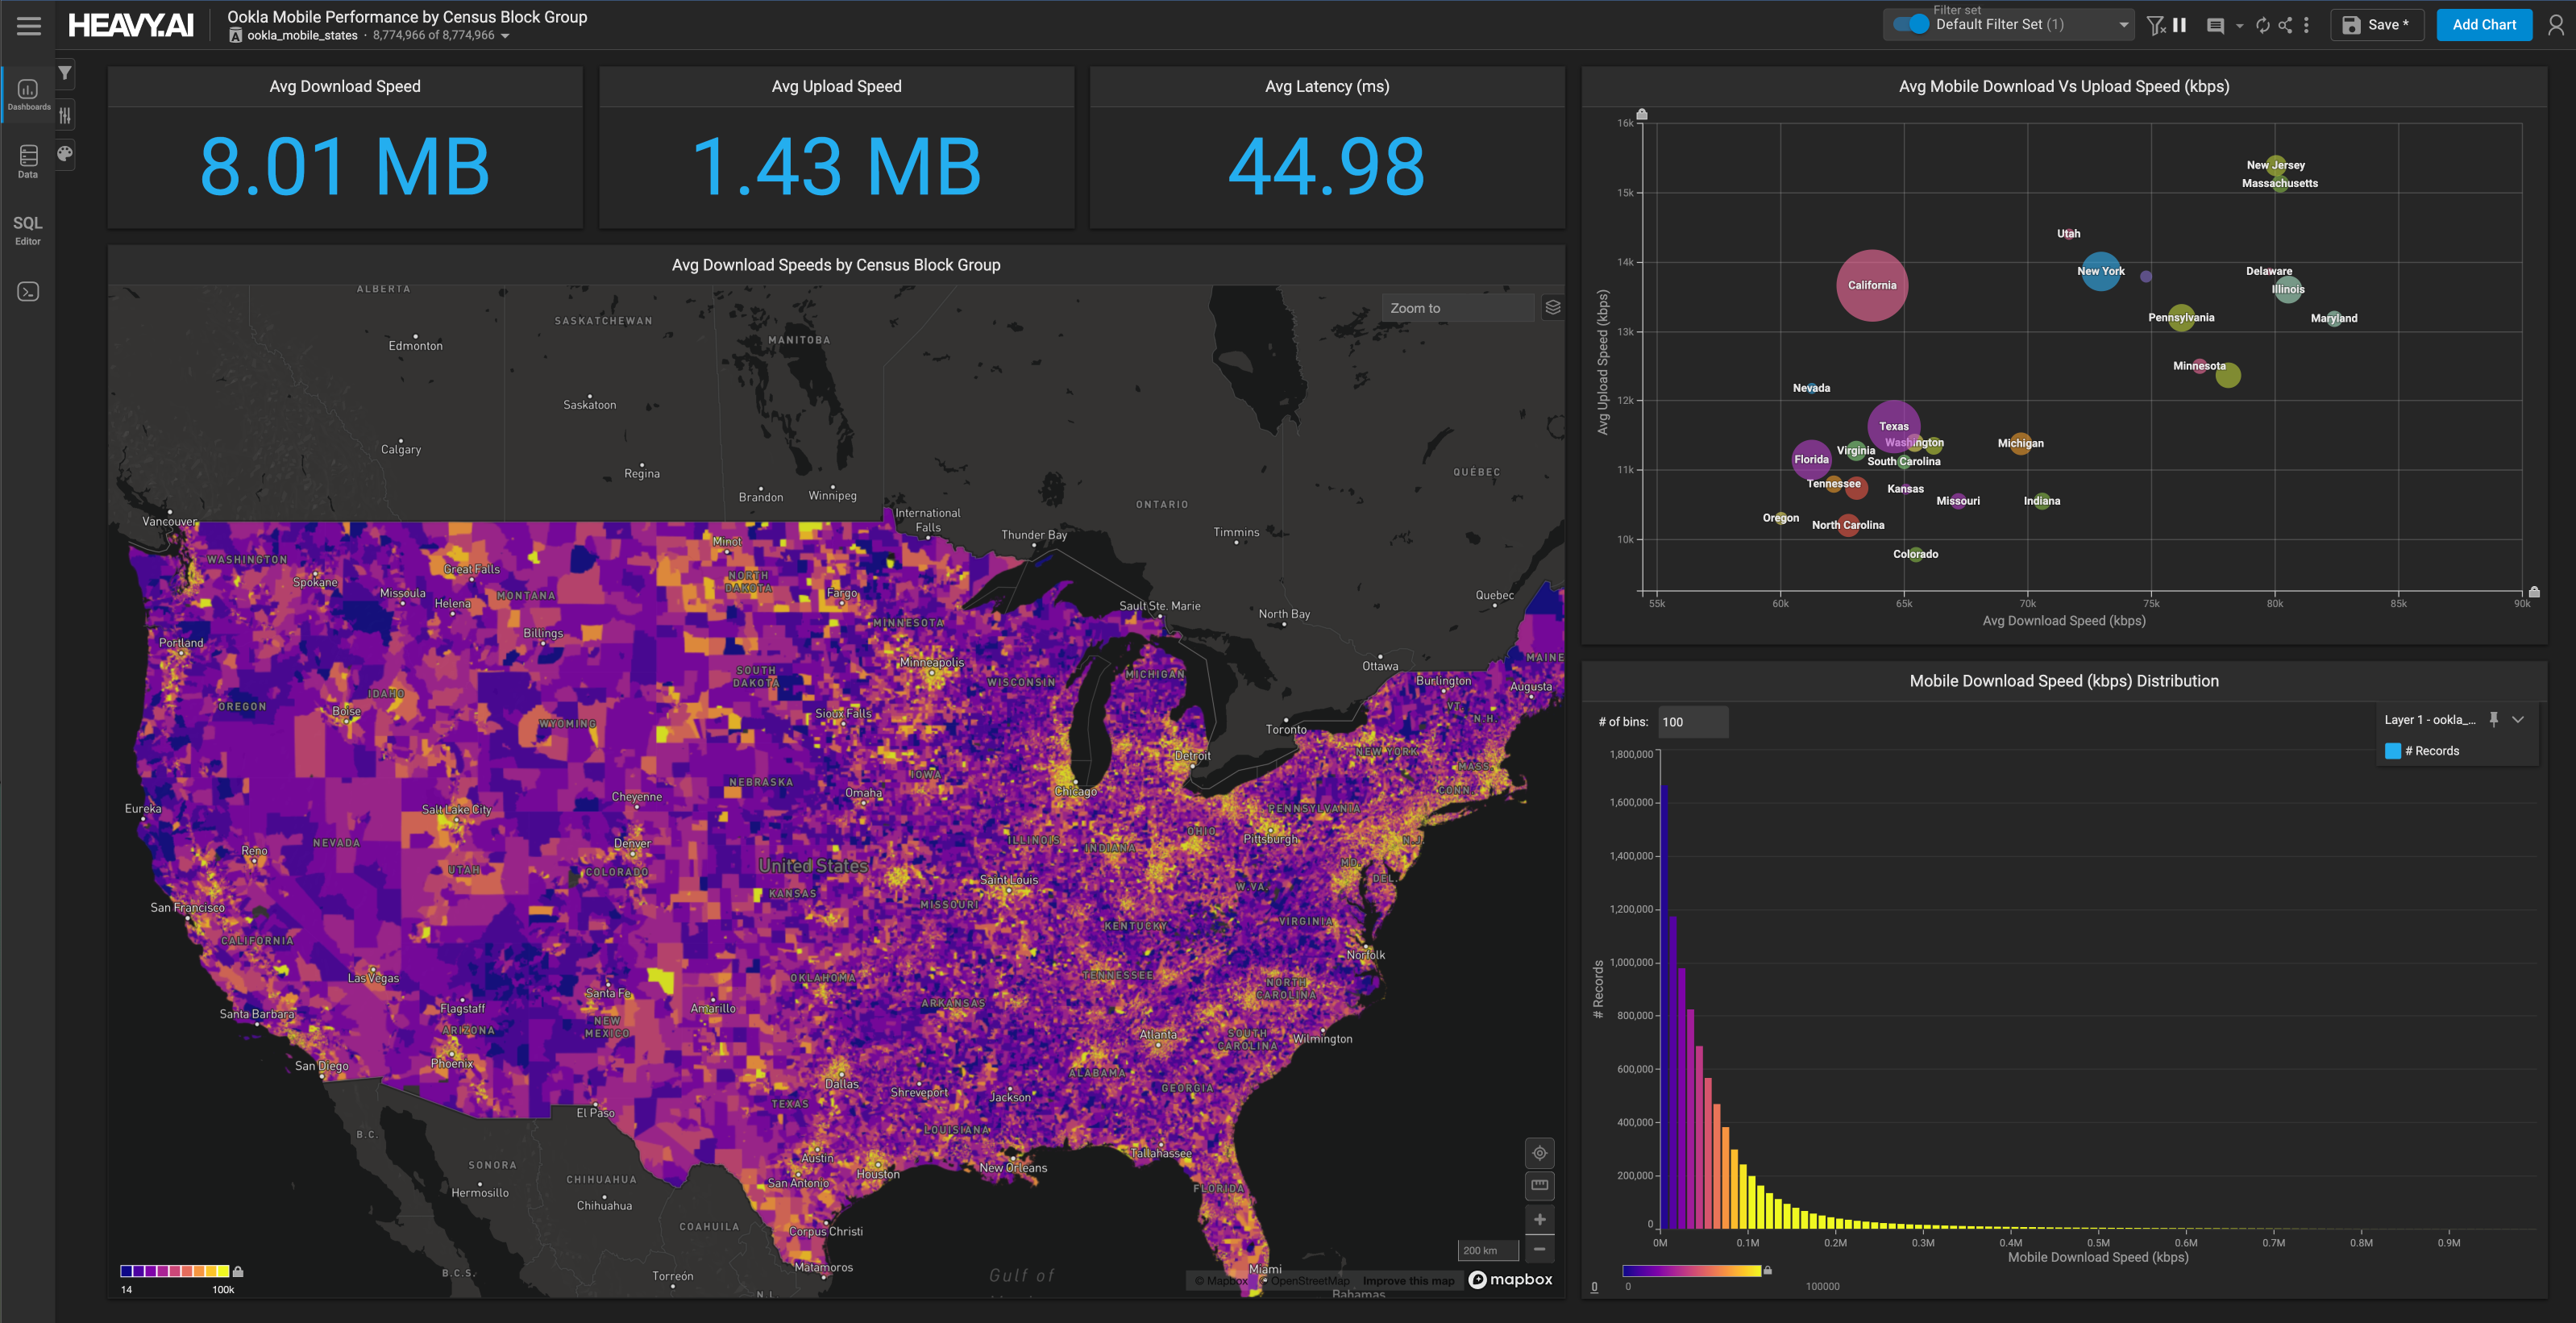
We’re very happy to announce OmniSci 5.5, our final release for 2020. With several new capabilities in OmniSciDB and Immerse, and also a major new OmniSci Render feature. This release sets the stage for more innovation in the new year across the entire platform. Without further delay, let’s dive right in!

Tru Optik, a TransUnion company, an identity resolution leader across streaming and connected media, has integrated OmniSci’s real-time analytics platform into its leading OTT (Over-the-Top) campaign measurement service Cross-Screen Audience Validation (CAV).

We are actively preparing the release of Immerse 5.5. When you will open it, you will be invited to use our new chart architecture. Why should you care? You should not. Just try it and enjoy faster and more robust charts.

How do we take full advantage of the enormous quantities of data streaming around us every day? The key is visualization. Big data visualizations help raw data tell a story that humans can understand and learn from.

OmniSci is proud to announce that we’ve been named a finalist for the 7th annual Glotel Telecoms Awards in the Telecoms Transformation category.

Learn about the ways GIS technologies are improving disaster response operations and the challenges facing disaster response teams.


