
Thank you to Robert Luciani for writing this guest post. He is from Foxrane, an OmniSci partner, and has supplied the logistics dataset and expertise used in OmniSci software.

OmniSci’s experimental Mac build now available to try, for 90 days - experience the power and possibilities of OmniSciDB and Immerse running on your Mac, bringing interactivity and scale together for data analytics.

OmniSci 5.3 includes new charts, deeper interactivity, simplified filtering & updated map experience enabling powering analysis for our end users.

Businesses are drowning in data but starving for insight, making the hiring of a data science team vital. But what makes up a data science team? What are the best practices for data science workflows? And what do data scientists need to execute their data science workflow to the best of their ability?

We’ve listened to your feedback, and the result is an easier and faster Immerse SQL Editor with our recent 5.2 release. Find out how the updated platform allows you to run selected queries, incorporate query snippets and run previous SQL statements.
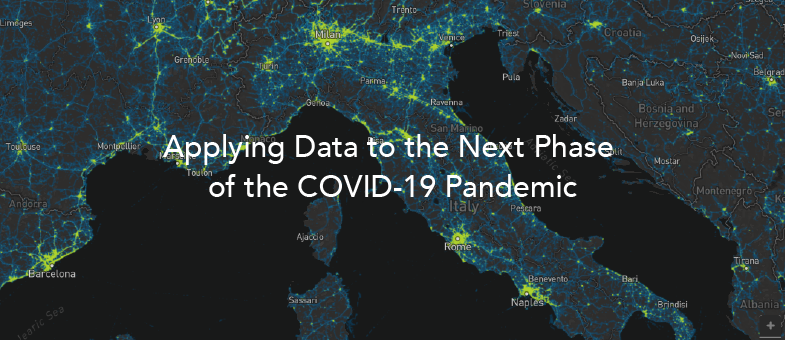
People on the frontlines of the next phase of the COVID-19 response need interactive, large-scale data analysis. Read our most recent blog post on geospatial analysis of anonymized, geographic datasets to see how we are supporting national relief efforts.

OmniSci Immerse provides self-refreshing dashboard functionality, but sometimes you need the ultimate flexibility of a custom app. Here’s how to use Plotly Python, Dash by Plotly and OmniSciDB to create a Plotly real-time data dashboard.

Exploring the opioid epidemic with GPU accelerated analytics and visualization.

To genuinely understand reservoir behavior, the oil and gas industry needs tools that can track and analyze data over long periods of time and for many unique variables. This post shows examples of tracking reservoir behavior across time. Traditional BI and GIS tools are too restrictive but with OmniSci's GPU and CPU innovations, accelerated analytics on billions of rows of data becomes possible.

5G promises tremendous revenue growth for the telecommunications industry, provided the industry can overcome the data challenges of optimizing capital planning around network architecture needs. There’s only one platform capable of visualizing billions of telecommunication records at once to improve coverage and reduce interference for 5G.


